

Key takeaways
- Different care settings require different metrics. Clinics optimize scheduling efficiency, while hospitals optimize patient flow.
- Using the wrong metrics leads to the wrong decisions. What works in clinics doesn’t translate to hospital complexity and vice versa.
- Most access issues come down to flow, not demand. Bottlenecks in coordination, capacity, and processes often constrain patient flow.
Clinics and hospital departments share a common mission: caring for patients.
Whether it’s a family physician managing timely appointments or a hospital unit coordinating complex treatments, care teams in each setting pursue better outcomes for their patients. This shared aim is critical. With a deficit of 22,800+ family physicians and a projected shortage of 117,000+ nurses by 2030, Canada needs every node of its healthcare system working in tandem.
However, clinics and hospital departments operate under different conditions. Clinics tend to deliver episodic, scheduled care with relatively predictable demand. Hospital departments, by contrast, manage higher-acuity patients in fluctuating volumes where interdependent workflows span multiple teams.
Yet many health systems still apply the same metrics across both settings, leading to poor visibility and misaligned decisions.
Explore how clinics and hospital departments function in three critical domains—care coordination, patient flow vs scheduling, and resource utilization—and the metrics that guide daily decisions for Canada’s patients.
1) How care gets coordinated
Hospital departments
Hospital departments operate within a dense web of logistical and administrative dependencies.
A single patient journey may involve emergency intake, diagnostic imaging, specialist consults, inpatient care, and discharge planning. Each step relies on different teams and resources. This interconnected environment increases the likelihood that delays in one area will cascade into others.
Thus, hospital departments track metrics that reflect their coordination needs. Leaders are more focused on how smoothly patients move across the system than on individual appointments. Variability in patient acuity further complicates planning, requiring flexible resource allocation and real-time visibility into operations.
Effective measurement in this context helps identify where breakdowns occur, such as in communication, capacity, or turnaround times, and provides the foundation for improving patient flow and reducing delays.
Care coordination metrics tracked by hospital departments
- Average length of stay (LOS): Measures how long patients remain in a department or unit. Longer stays can indicate bottlenecks in diagnostics, treatment, or discharge processes.
- Turnaround time: Tracks how quickly critical services are completed. Delays here often ripple across the entire patient journey.
- Transfer delay time: Captures how long patients wait to move between departments (e.g. ED to inpatient bed), highlighting coordination issues.
- Bed turnover rate: Indicates how efficiently beds are freed and reassigned, reflecting both discharge processes and capacity management.
Clinics
Clinic settings are more contained and predictable than hospital environments.
Patient interactions are typically scheduled in advance, so workflows are standardized, and care delivery is often limited to a single provider or small team. While complexity still exists—especially in multi-provider or specialty clinics—it is generally more localized than in hospitals.
This makes operational complexity in clinics less about cross-system coordination and more about consistency. The goal is to ensure that each day runs as planned: appointments start on time, providers stay on schedule, and patients move through visits efficiently. Small disruptions like late arrivals quickly compound and affect the entire day.
Clinic metrics help maintain control over these variables. They focus on identifying inefficiencies within the clinic’s immediate workflow and ensuring that resources, particularly provider time, are used effectively.
Care coordination metrics tracked by clinics
- Average visit duration: Tracks how long appointments take compared to what was scheduled, helping identify inefficiencies or mismatches in booking.
- Clinic overrun time: Measures how often and by how much clinics run past scheduled hours, indicating workflow or scheduling issues.
- Patient cycle time: Captures the total time a patient spends in the clinic from arrival to departure, reflecting overall operational efficiency.
- Staff-to-provider ratio: Assesses whether staffing levels appropriately support providers, impacting both efficiency and patient experience.
37,000+ physicians leverage Petal Workforce to reduce scheduling burden.
2) Patient flow vs Schedule management
Hospital departments
In hospital departments, patient flow is a central challenge.
Hospitals can’t rely on fully scheduled demand, because patients arrive unpredictably and often require urgent care. Therefore, it’s essential to focus on how patients move through the system rather than when they arrive.
Flow-focused metrics help departments understand where congestion occurs and how efficiently patients progress from one stage of care to the next. Delays in flow lead to overcrowding, increased wait times, and strained resources, particularly in high-pressure areas like EDs.
Improving flow requires visibility across the entire patient journey. Departments must coordinate closely, ensuring that downstream capacity is available to prevent upstream bottlenecks.
Patient flow metrics tracked by hospital departments
- Time to treatment: Measures how quickly patients receive care after arrival, a critical indicator of responsiveness and access.
- Boarding time: Tracks how long patients wait for an inpatient bed after being admitted, often signaling downstream capacity issues.
- Throughput rate: Assesses how many patients are processed within a given timeframe, reflecting overall system efficiency.
- Left without being seen (LWBS): Indicates the number of patients who leave before receiving care, often due to excessive wait times.
Clinics
Clinics rely heavily on scheduling as their primary mechanism for managing access.
Appointment templates, provider availability, and patient demand must be carefully aligned to ensure that care is delivered efficiently and predictably. Unlike hospitals, clinics have greater control over when patients are seen—but that control depends on how well schedules are designed and maintained.
Scheduling metrics help clinics balance supply and demand. Overbooking leads to frustrated patients and provider burnout, while underbooking results in unused capacity and reduced access. No-shows and cancellations introduce additional variability, making it essential to monitor and adapt scheduling strategies over time.
In this environment, metrics provide insight into where adjustments are needed. This includes refining appointment lengths, improving patient reminders, or redistributing provider time.
Schedule management metrics tracked by clinics
- No-show rate: Tracks the percentage of missed appointments, directly impacting access and resource utilization.
- Time to third next available appointment: A standard measure of access, indicating how long patients wait for non-urgent care.
- Schedule utilization rate: Measures how much of the available appointment time is filled, reflecting demand alignment.
- Cancellation rate: Monitors how often appointments are canceled, helping identify patterns and opportunities for intervention.
Petal helped Quebec avoid 814,000 ED visits while redirecting 353,000 patients to primary care.
3) How resources are used
Hospital departments
Hospital departments must manage a wide range of resources simultaneously—beds, equipment, clinical staff, and specialized facilities like operating rooms.
Utilization in this context is multi-dimensional, requiring a balance between maximizing capacity and maintaining flexibility for urgent or unpredictable cases.
Overutilization leads to staff burnout and reduced quality of care, while underutilization represents missed opportunities to improve access. The challenge lies in aligning resource availability with fluctuating demand, often in real time. Given that Canadian EDs have closed their doors for at least 1.14 million hours since 2019, making the most of available resources is paramount to facilitate consistent care.
Metrics related to utilization help departments understand how effectively resources are being deployed. They provide insight into whether capacity constraints are limiting access or whether inefficiencies are leaving resources idle.
Resource metrics tracked by hospital departments
- Bed occupancy rate: Indicates the percentage of beds in use, helping assess capacity pressures and availability.
- Operating room (or) utilization: Measures how effectively surgical time is used, including delays and idle periods.
- Staff utilization rate: Tracks how clinical staff time is allocated, balancing workload and efficiency.
- Equipment utilization: Assesses how frequently critical diagnostic tools are used, highlighting bottlenecks or underuse.
Clinics
In clinics, utilization is more narrowly focused on provider time.
Physicians and other care providers are the primary resource, and their availability directly determines how many patients can be seen. Supporting resources like exam rooms and administrative staff are important, but the central focus is maximizing provider capacity.
The goal is to generate patient interactions without overloading providers or compromising care quality. This requires careful calibration, as too much idle time reduces access and overly packed schedules lead to rushed visits.
Utilization metrics in clinics helps care teams strike this balance. They offer a clear view of how provider time is allocated and whether adjustments are needed to improve efficiency or expand access.
Resource metrics used by clinics
- Provider utilization rate: Measures the proportion of provider time spent in patient-facing activities, indicating efficiency.
- Patients seen per day: Tracks volume at the provider level, helping assess capacity and workload.
- Idle time between appointments: Identifies gaps in schedules that could be optimized to improve access.
- Panel size per provider: Reflects the number of patients assigned to a provider, helping balance demand with available capacity.
We’re here for Canada’s care teams

Whether you’re in a clinic or hospital department, Petal tools make it easier to deliver top-quality care.
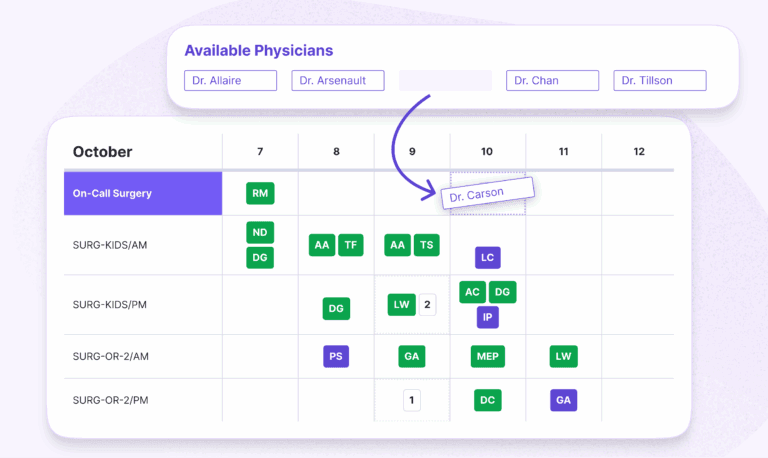
Petal Workforce makes scheduling and communications simpler. Build and publish automated schedules in minutes while reducing manual errors and administrative overhead.
- Proof: The University of Montreal Hospital Centre (CHUM) reduced scheduling time by 98% and achieved 92% staff satisfaction while generating $610,000 in direct benefits per year.
Petal Patient Hub redirects patients to unlock network capacity and improve patient outcomes system wide.
- Proof: The Government of Quebec redirects 800+ patients daily to more appropriate care settings while generating $2M per week in economic benefits and achieving 12.5% fewer low-acuity ED visits (CTAS 4–5).
Your team works hard. Petal is here to make your hard work go further.
Make your operation run smoother for providers and patients: